Case Analysis
CHALLENGE
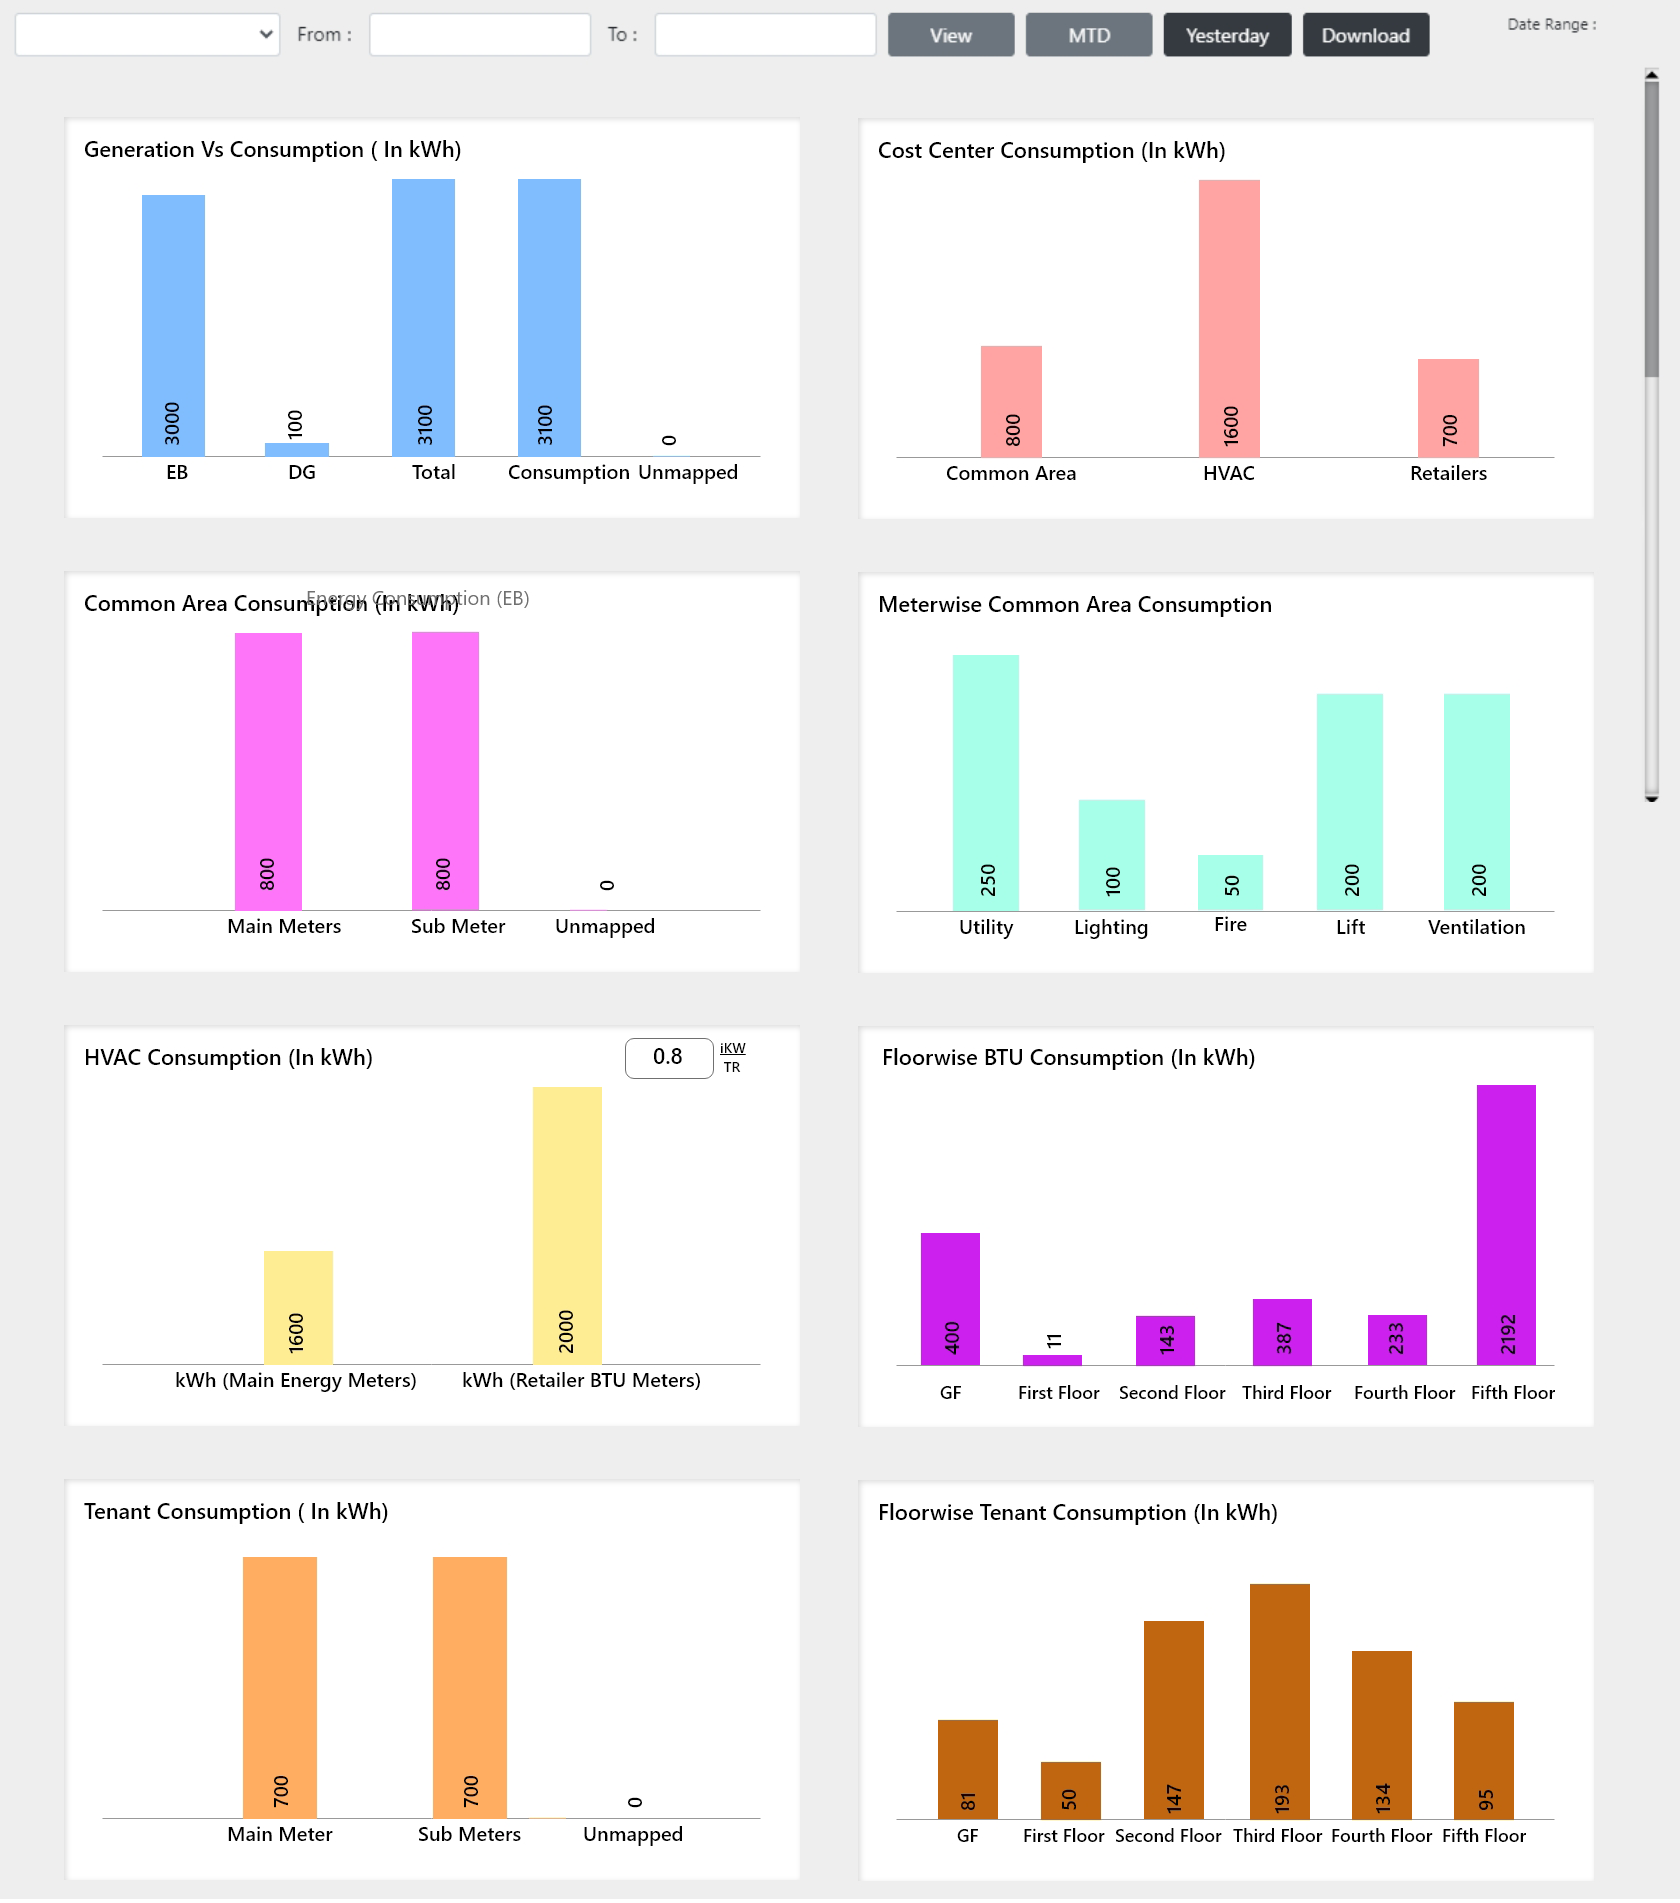
HVAC Consumption
SOLUTION
RESULTS
- Saved Energy
- Reduced Cost
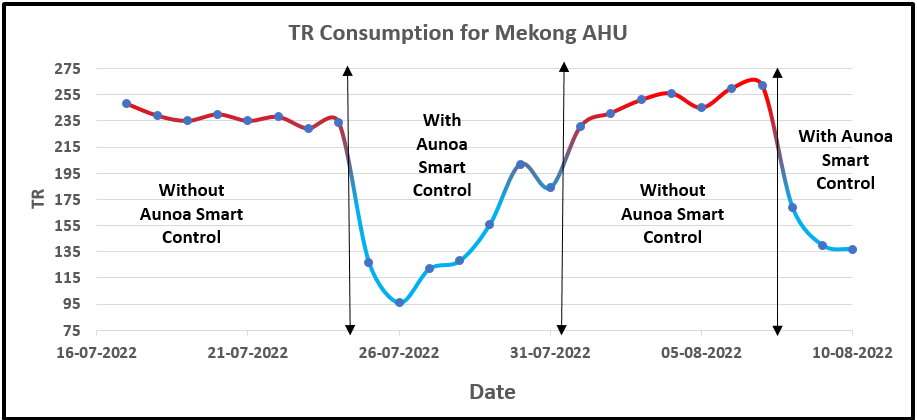
Savings in Mekong AHU
TR Saved per day
100 Tr
Kwh Saved per day
90 KwH
INR Saved per day
810 INR
Wireless Utility Management System
Trial No. | Customer Existing Condition | Aunoa’s Dynamic Scheduling | ||
From Date | To Date | From Date | To Date | |
1 | 17/07/2022 | 24/07/2022 | 25/07/2022 | 31/07/2022 |
2 | 01/08/2022 | 07/08/2022 | 08/08/2022 | Onwards |
Reduction in Cooling energy (TR) consumption of 100 TR was achieved
Operation schedule with customer existing condition
Slot | From | To | Setpoint |
1 | 10:40 | 14:30 | 16 |
2 | 18:00 | 23:30 | 16 |
Operation Schedule with Aunoa’s Dynamic scheduling
Slot | From | To | Setpoint |
1 | 10:40 | 11:44 | 26 |
11:45 | 12:44 | 25 | |
12:45 | 14:44 | 23 | |
14:45 | 15:30 | 24 | |
15:31 | 16:00 | 25 | |
2 | 18:00 | 18:59 | 26 |
19:00 | 19:59 | 25 | |
20:00 | 20:59 | 23 | |
23:00 | 23:30 | 25.5 |
ANALYSIS FOR SAVINGS / AHU
Parameters Monitored | Without Aunoa Control | With Aunoa Control |
Average Chilled water valve actuator opening | 87% | 72% |
Average chilled water supply temperature (oC) | 13.2 | 13 |
Average return air temperature (oC) | 23 | 23.6 |
Average TR consumed per hour | 19 | 16 |
Average TR consumed per day | 235 | 135 |
Total electrical energy consumed by AHU cooling load per day (KWH) | 211.5 | 121.5 |
Savings % | Upto 40 % | |
Note: Considering iKW/TR for chiller system from chiller Libe data of 0.88Kw /TR
AVERAGE DAILY SAVINGS IN KWH per AHU
Total Savings in TR per day | 100 TR |
Total savings in energy per day in KWH | 90 KW |
Savings In Rs per day | 810 |
Note : Considered cost of power @ Rs 9 /kw
Aunoa Smart Controls installed for 18 nos. Air Handling Units.