Case Analysis
CHALLENGE
SOLUTION
RESULTS
- Reduced time in data collection and processing
- Timely billing the tenants
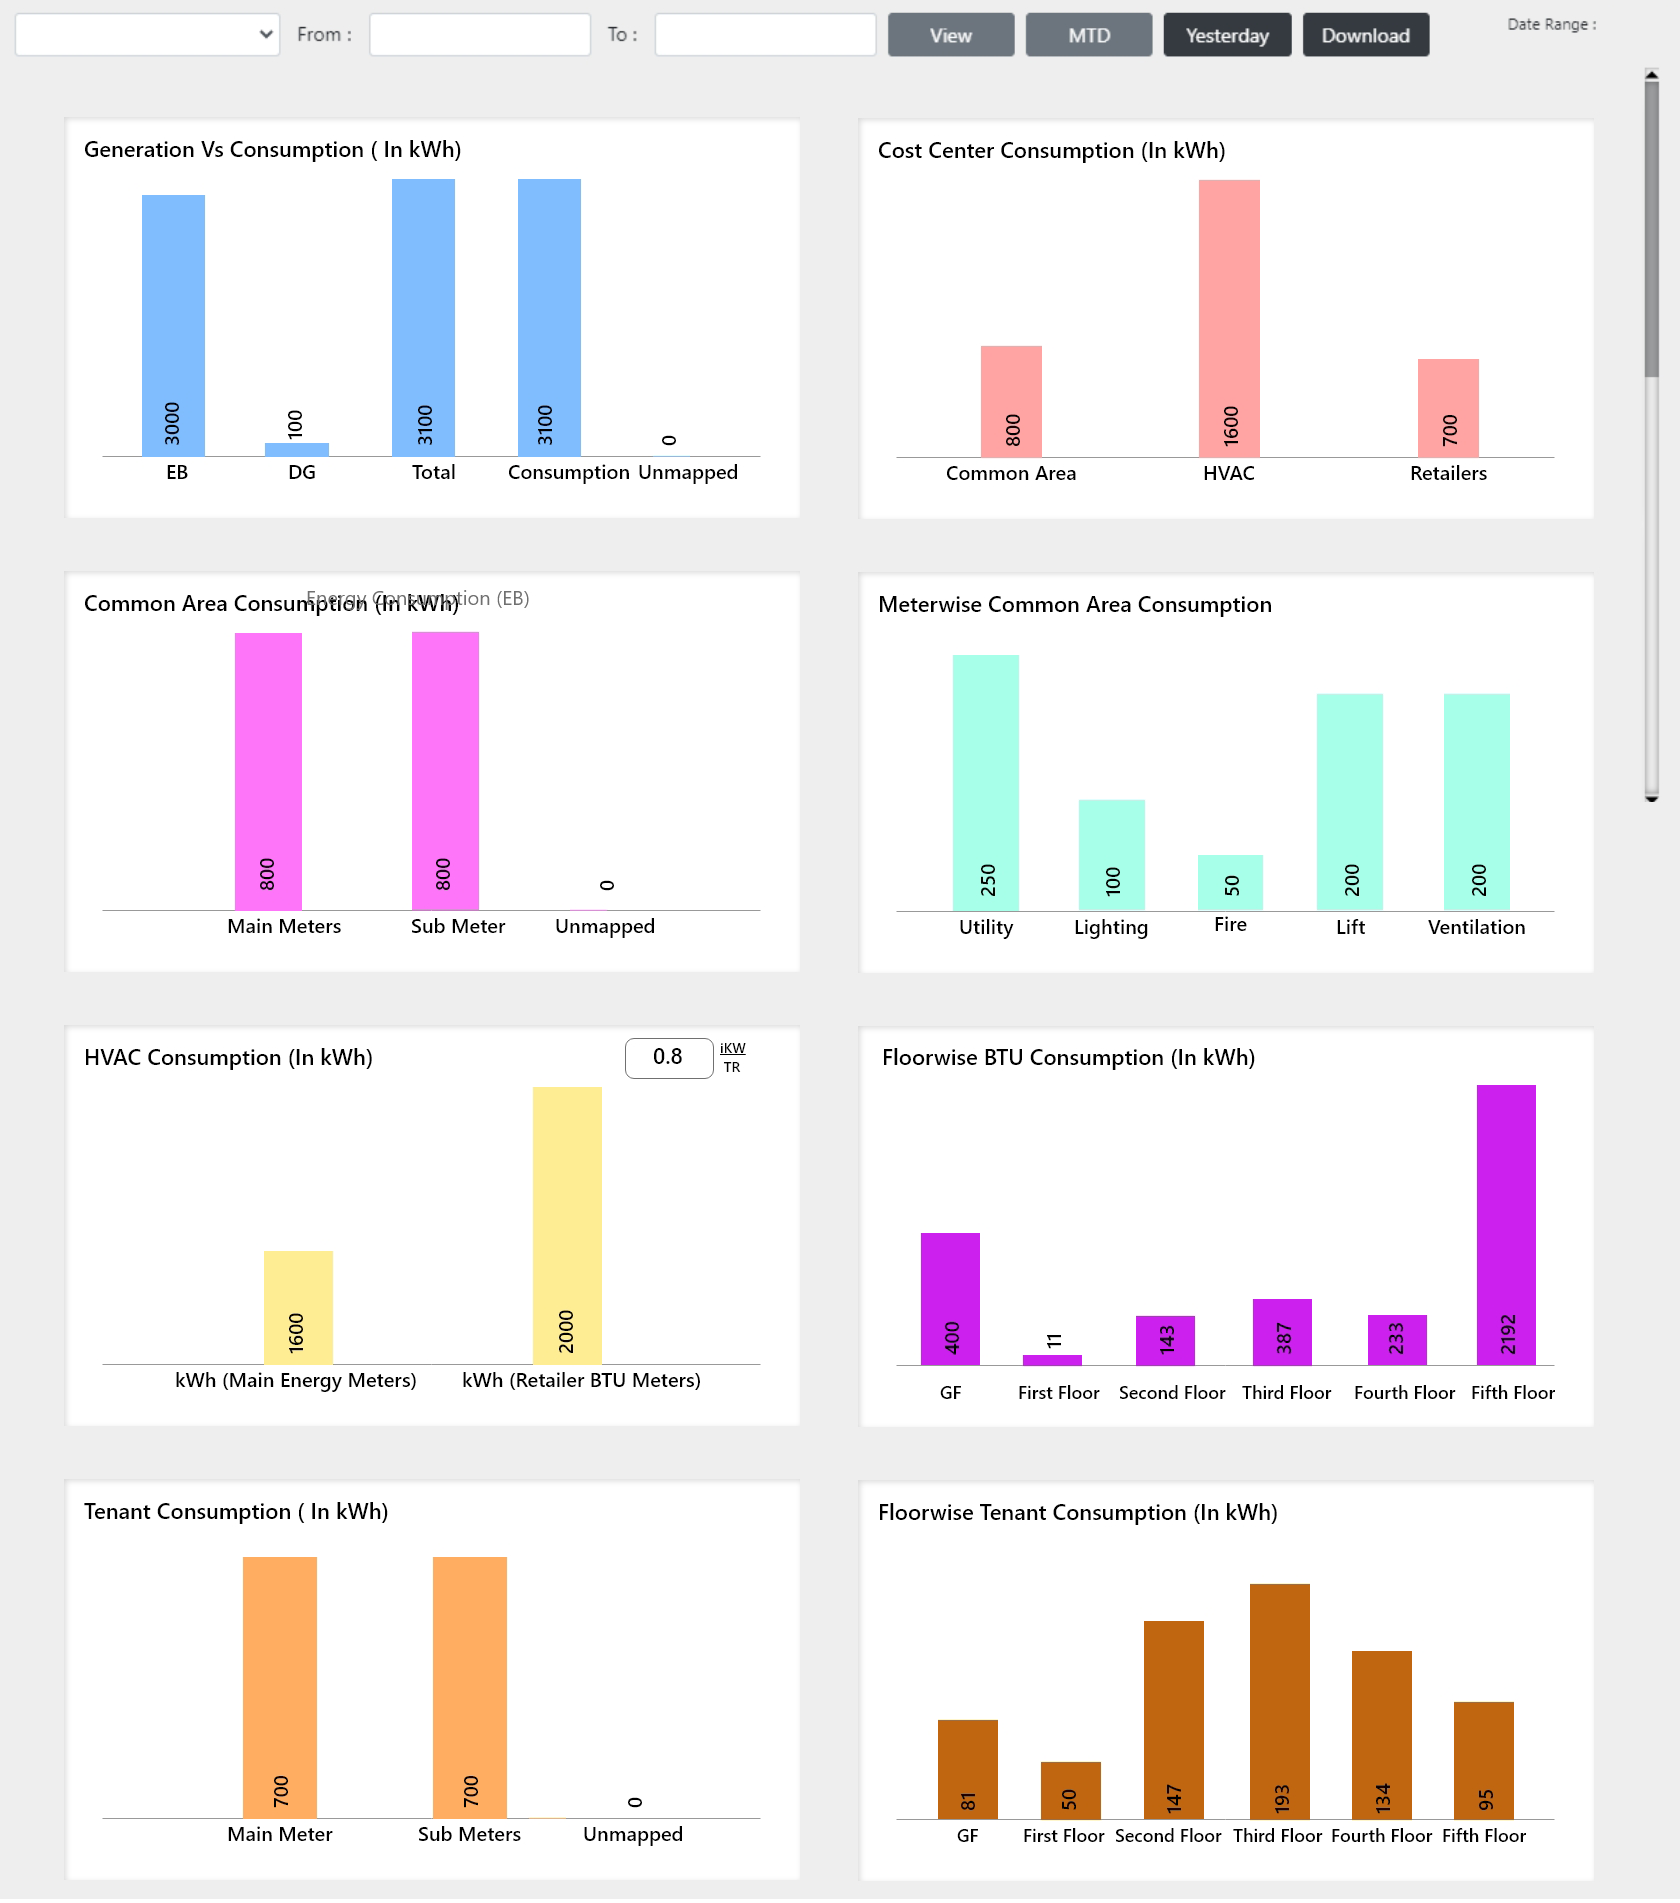
Highlights Savings HVAC Consumption
Reduction in utility billing time
95%
Increase in Data Accuracy
Prestige Atrium a Commercial complex in Bangaluru reduces the time for gathering and processing data by 95 %, resulting in timely billing for utilities.
Challenges
Long time in gathering the data of consumption for electrical energy and cooling load (BTU) and then processing the gathered data for transmission losses along with and common area energy consumption for more than 50 tenants, resulted in delayed bill submission to tenants which lead to loss of time for revenue generation.
Solution
A detailed analysis was carried out and the below solutions had been provided and achieved 95 % reduction in data gathering and processing time with Optimization on the Manpower on the operations front and real time monitoring of the electrical energy and cooling load consumption.
Project
Aunoa Wireless Auto Billing was started in the month of July 2022 and completed in the span of just a span of 20 days, the project consisted of mapping and monitoring of all the electrical energy meters and the BTU meters installed for tenants as well as for Common Area along with the DG fuel consumption.
Results
Conditions Before and After Aunoa Smart Wireless Auto Billing System
| Before Manual Readings | After Auto Mapping | |||
|---|---|---|---|---|
| Energy Meter | BTU Meter | Energy Meter | BTU Meter | |
| Reading Recurrence | Everyday | Once/Month | Everyday | Everyday |
| Total Quantity | 58 | 42 | 58 | 42 |
| Time for 1 meter reading | 2 mins | 3 mins | 0 | 0 |
| Total time for all meters /day | 2 hours | 3 hours | 0 | 0 |
| Time for data entry /day | 1 hour | 1 hour | 0 | 0 |
| Total man hours / month | 90 hours | 3 hours | 0 | 0 |
| Data Accuracy | 98% | 98% | 100% | 100% |
Conditions After Aunoa Smart Wireless Auto Billing System
After Successful Commissioning of Aunoa Smart Wireless Auto Billing System the time for preparation of utility consumption reports was brought down to a few minutes. Ie the time taken for downloading reports.
List of customized reports generated:
- Tenant electrical energy consumption report in KWh and INR along with transmission losses
- HVAC cooling load consumption report in BTU and INR along with accessories consumption distribution.
- Profit analysis report for Inflow and out flow comparison.
EFFECTIVE BILLING
Reduction in Billing time
OPTIMISED MANPOWER
Reduction in data collection and processing time up to 95 %